Streamline fund operations with an AI analyst
Streamline fund operations with an AI analyst
Streamline fund operations with an AI analyst
Faster access to portfolio data for investors and LPs, and efficient analysis across portfolio companies and funds
Faster access to portfolio data for investors and LPs, and efficient analysis across portfolio companies and funds
Faster access to portfolio data for investors and LPs, and efficient analysis across portfolio companies and funds
Backed by Y Combinator


Trusted by
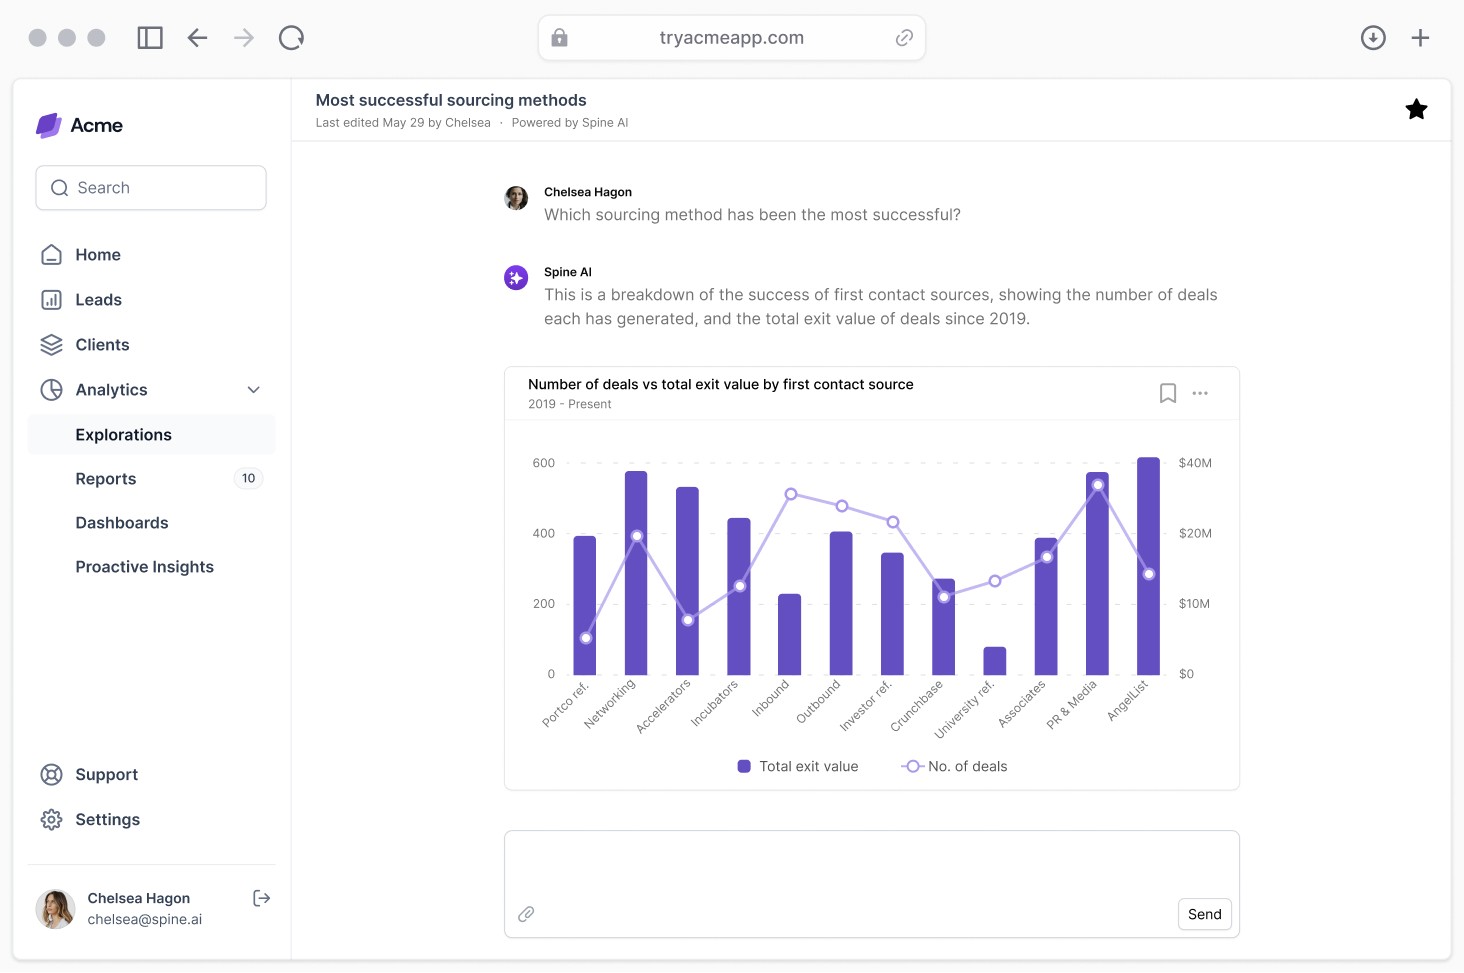
Answers to plain language questions
Save time on ad hoc questions, get answers to investors and LPs faster


Helen Parr
Which company has the highest increase in profits and why?


Process
Collapse
Searching through database “portfolio_companies”
Reviewing investor update decks from unstructured sources
Filtered with period fiscal year 2024, period fiscal quarter Q4, and period length LTM
Acme Inc. has had the highest jump of 87% in profits. This is largely due to their investments in using AI to reduce their Opex as cited in their last investor update

Helen Parr
Which company has the highest increase in profits and why?


Process
Collapse
Searching through database “portfolio_companies”
Reviewing investor update decks from unstructured sources
Filtered with period fiscal year 2024, period fiscal quarter Q4, and period length LTM
Acme Inc. has had the highest jump of 87% in profits. This is largely due to their investments in using AI to reduce their Opex as cited in their last investor update
Real self-serve answers for ad hoc questions
Give your organization direct access to portfolio and fund data, with plain language chat that can accurately answer their questions with structured and unstructured data
Give your organization direct access to portfolio and fund data, with plain language chat that can accurately answer their questions with structured and unstructured data
Give your organization direct access to portfolio and fund data, with plain language chat that can accurately answer their questions with structured and unstructured data
Access custom views of structured data, such as summarizing performance metrics by fund, or confirming total investment size per company
Access custom views of structured data, such as summarizing performance metrics by fund, or confirming total investment size per company
Access custom views of structured data, such as summarizing performance metrics by fund, or confirming total investment size per company
Get a more complete understanding of the context behind portfolio performance with unstructured data from board meeting decks, company update emails and investor notes
Get a more complete understanding of the context behind portfolio performance with unstructured data from board meeting decks, company update emails and investor notes
Get a more complete understanding of the context behind portfolio performance with unstructured data from board meeting decks, company update emails and investor notes
Customized for your data and your funds
Truly plain language. No query language to learn.
Truly plain language. No query language to learn.
Truly plain language. No query language to learn.
Use internal terminology and acronyms, exactly as you would with a human analyst
Use internal terminology and acronyms, exactly as you would with a human analyst
Use internal terminology and acronyms, exactly as you would with a human analyst
Direct control over custom measures ensures that growth rates, MOIC, TVPI, RVPI and everything else is calculated exactly as you expect
Direct control over custom measures ensures that growth rates, MOIC, TVPI, RVPI and everything else is calculated exactly as you expect
Direct control over custom measures ensures that growth rates, MOIC, TVPI, RVPI and everything else is calculated exactly as you expect
Fund II – All Metrics
Last edited May 29 by Esther
Fund II – Follow on investments
Last edited Jun 06 by Louis
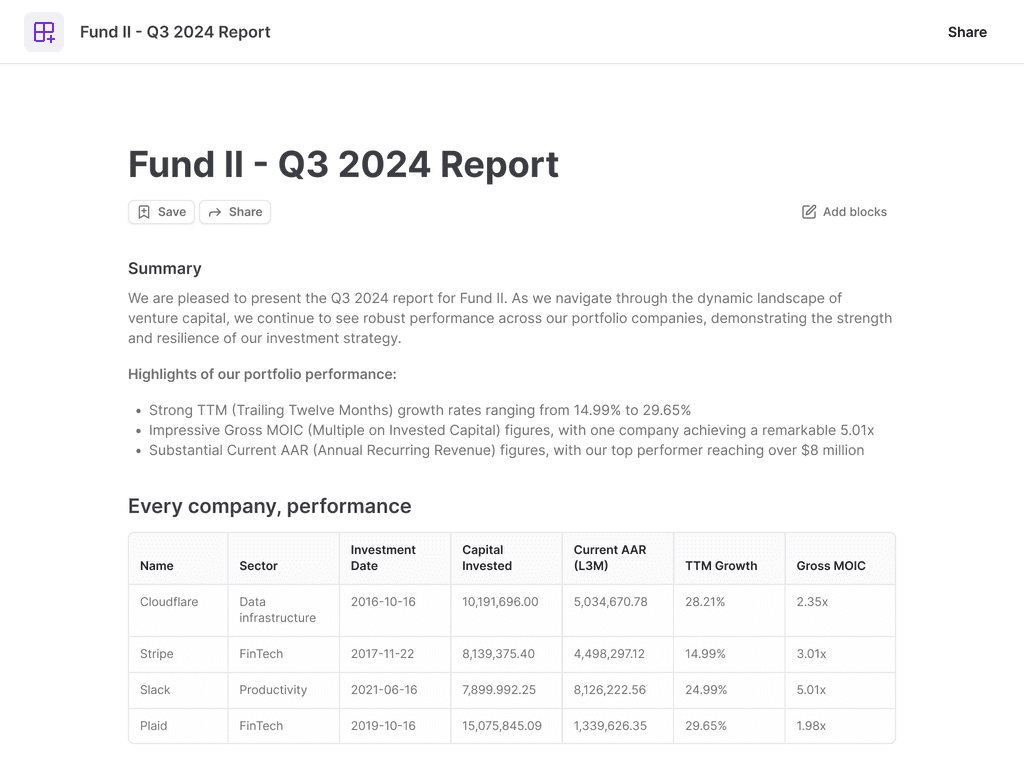
Fund II – Every company, performance
Last edited yesterday by Annie
Fund II – Summary of cash transactions
Last edited May 29 by Esther
Fund II – All Metrics
Last edited May 29 by Esther
Fund II – Follow on investments
Last edited Jun 06 by Louis
Fund II – Every company, performance
Last edited yesterday by Annie
Fund II – Summary of cash transactions
Last edited May 29 by Esther


Process
Collapse
Query: when was our most recent investment in stripe?
Retrieved relevant data from the cash_transactions table
Filtered with investment as Stripe
Sorted with transactionDate in descending order

Process
Collapse
Query: when was our most recent investment in stripe?
Retrieved relevant data from the cash_transactions table
Filtered with investment as Stripe
Sorted with transactionDate in descending order
Full transparency into the source of answers
Simple step by step explanations of the process make it clear how the question was interpreted, what data source was accessed, and how it was processed to produce the response
Simple step by step explanations of the process make it clear how the question was interpreted, what data source was accessed, and how it was processed to produce the response
Simple step by step explanations of the process make it clear how the question was interpreted, what data source was accessed, and how it was processed to produce the response
Control which default metrics are associated with key concepts, like fund or investment performance
Control which default metrics are associated with key concepts, like fund or investment performance
Control which default metrics are associated with key concepts, like fund or investment performance
Nuanced questions flagged for human review
Add metrics across all companies in your portfolio from iLevel, spreadsheets, PPTs, and PDFs
Add metrics across all companies in your portfolio from iLevel, spreadsheets, PPTs, and PDFs
Add metrics across all companies in your portfolio from iLevel, spreadsheets, PPTs, and PDFs
Validate and show discrepancies in the data so you can choose the actual source of truth
Validate and show discrepancies in the data so you can choose the actual source of truth
Validate and show discrepancies in the data so you can choose the actual source of truth
Extract and update all metrics for a single company for a new quarter, even if updates come from a PDF or slide deck.
Extract and update all metrics for a single company for a new quarter, even if updates come from a PDF or slide deck.
Extract and update all metrics for a single company for a new quarter, even if updates come from a PDF or slide deck.


Noah Pierre
Any signs of outperformers/breakouts in our portfolio?


Spine AI
Low confidence
Submit to Analyst
Retrieved relevant data from the actual_with_Itm and investment tables
Filtered with period_length as L3M and arr_growth_percent, gross_irr, enterprise_value greater than or equal to their thresholds
Identified breakout companies in the portfolio

Noah Pierre
Any signs of outperformers/breakouts in our portfolio?


Spine AI
Low confidence
Submit to Analyst
Retrieved relevant data from the actual_with_Itm and investment tables
Filtered with period_length as L3M and arr_growth_percent, gross_irr, enterprise_value greater than or equal to their thresholds
Identified breakout companies in the portfolio
Keep your data and analysis up to date, with minimal manual verification
Keep your data and analysis up to date, with minimal manual verification
Acme, Inc
...
Acme's projected performance
New metrics are available for Acme's projected financial performance in two recently uploaded documents:
Acme company update
Board_meeting_Oct 23.pptx
October 26, 2024
Extract data from board decks and company updates as they become available
Keep structured performance metrics up to date and save on hours of manually reviewing documentation for new performance projections.
Automated discrepancy detection across data sources, and structured data extraction save time and improve accuracy.
Maintain an auditable record of the source of data.
Automatically propagate updated data to reports and dashboards for valuation analysis, quarterly reporting and more
Spine integrates seamlessly with the tools you already use
Dynamic dashboards and reports
Custom reporting that shows the full picture and makes analysis scalable
Custom reporting that shows the full picture and makes analysis scalable
Bring together data and the context to make sense of it
Gather all the information you need for comprehensive analysis in one place.
Gather all the information you need for comprehensive analysis in one place.
Gather all the information you need for comprehensive analysis in one place.
Not just structured data and metrics. Incorporate relevant context from unstructured documents, such as board decks or meeting notes.
Not just structured data and metrics. Incorporate relevant context from unstructured documents, such as board decks or meeting notes.
Not just structured data and metrics. Incorporate relevant context from unstructured documents, such as board decks or meeting notes.
Automatically search relevant documents to uncover key context, such as changes to the competitive landscape, growth strategy, or market demand.
Automatically search relevant documents to uncover key context, such as changes to the competitive landscape, growth strategy, or market demand.
Automatically search relevant documents to uncover key context, such as changes to the competitive landscape, growth strategy, or market demand.
Add your own notes to track additional context, such as the deal team's commentary, or rationale for valuation multiples.
Add your own notes to track additional context, such as the deal team's commentary, or rationale for valuation multiples.
Add your own notes to track additional context, such as the deal team's commentary, or rationale for valuation multiples.


Acme Inc: Active users over time
400
300
200
100
0
0
100
200
300
400
Add to AI chat
Add to new report
Inspect data source
Use as template
Share
Save time on repetitive analysis with templates
Automate context gathering for standard analysis by using templates for quarterly reporting by fund, valuation reports for portfolio companies, or monitoring reports for LPs.
Automate context gathering for standard analysis by using templates for quarterly reporting by fund, valuation reports for portfolio companies, or monitoring reports for LPs.
Automate context gathering for standard analysis by using templates for quarterly reporting by fund, valuation reports for portfolio companies, or monitoring reports for LPs.
Retain the flexibility to refine and adjust what information is included.
Retain the flexibility to refine and adjust what information is included.
Retain the flexibility to refine and adjust what information is included.
Fully customizable content powered by AI
Gain the efficiencies of AI features but stay in control of the final content
Gain the efficiencies of AI features but stay in control of the final content
Gain the efficiencies of AI features but stay in control of the final content
Autogenerate charts from existing data, or manually customize their format
Autogenerate charts from existing data, or manually customize their format
Autogenerate charts from existing data, or manually customize their format
Summarize all the content on a page to draft quarterly reports or valuations memos
Summarize all the content on a page to draft quarterly reports or valuations memos
Summarize all the content on a page to draft quarterly reports or valuations memos
Add block
AI Exploration
AI Summary
Chart
Table
Note
Backed by the best
Streamline your FundOps and make the most of your portfolio data, with an AI analyst.


